4 in 100
Americans said the political system was working extremely or very well.
Pew Research Center, 2023

Parallax brings creative tools, video production and performance learning together for organizations working on democracy.
You have something worth saying. Let’s bring it to life.
Meet PAX, your creative helper. Give it a tap.
01The audience
4 in 100
Americans said the political system was working extremely or very well.
Pew Research Center, 2023
43%
identified as independents, compared with 28% for each major party.
Gallup, 2024 data (published 2025)
Sources: Pew Research Center, 2023 (opens in a new tab); Gallup, 2024 data (published 2025) (opens in a new tab). Historical survey findings, not current estimates.
Alongside this broader context, our work explores how electoral systems function. Here, a familiar pizza analogy explains the outsized influence of a small primary electorate.
Electoral systems, explained.
A pizza analogy explains how low-turnout primaries and safe seats can give a small share of voters an outsized role in choosing Congress.
02The platform
The Partner Portal keeps the script, the recording and the captions in one place, with PAX helping you find the words.
Already recorded something? Bring it in and finish it here.
Start from a blank page, in your own words.
Pick a ready script and make it yours.
Answer a few questions and PAX drafts a starting point you can edit.
With PAX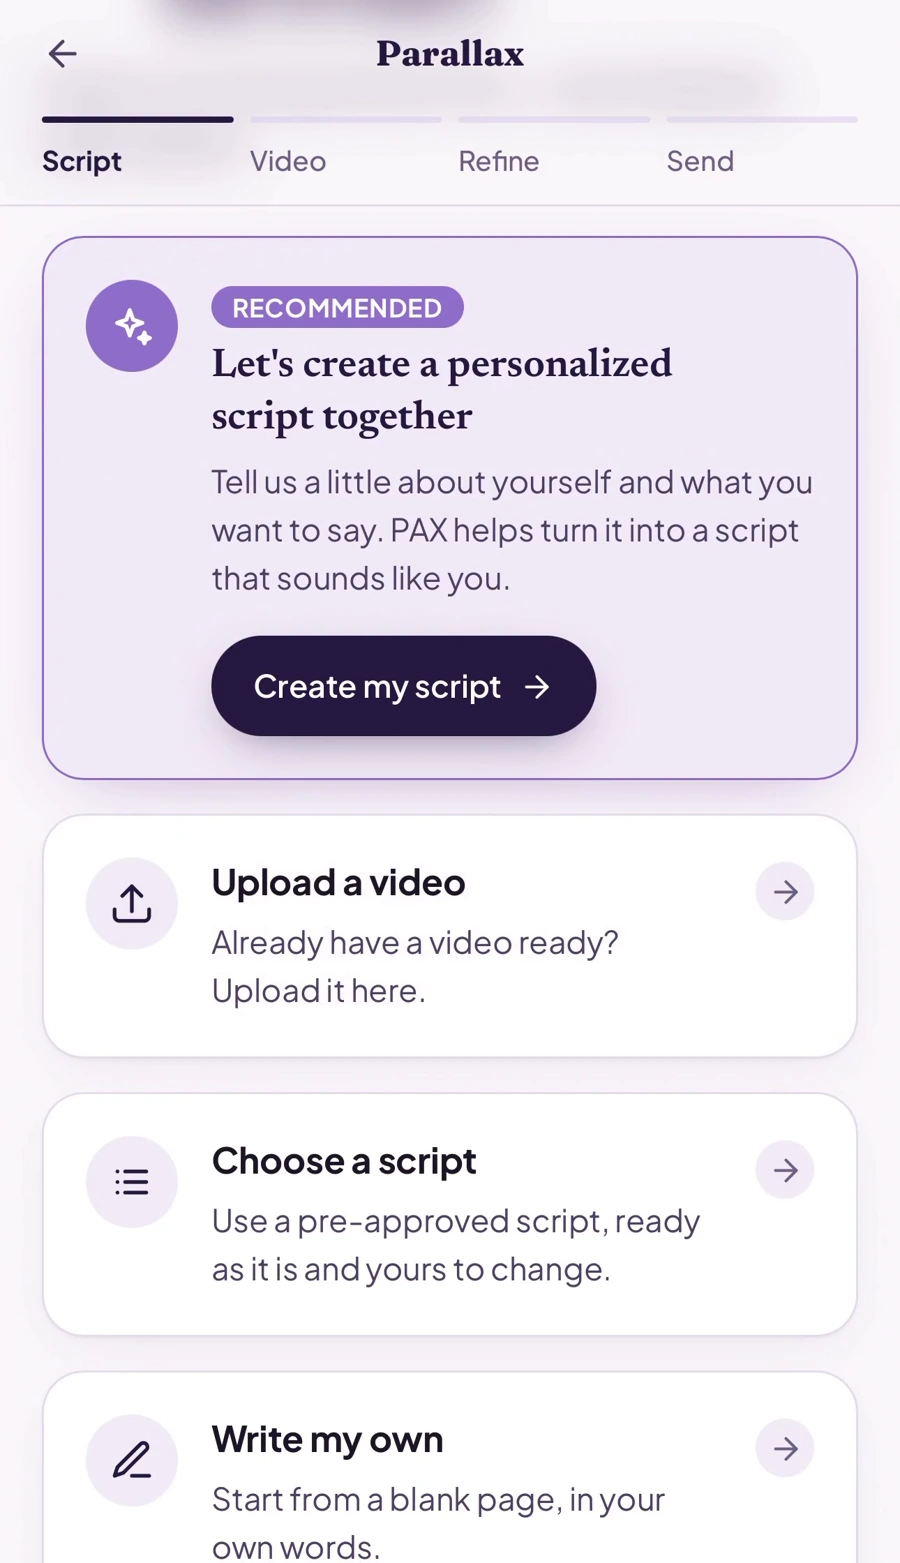

03Our work
Explainers, interviews and commentary, made with people who have something to say.
A familiar voice paired with on-screen statistics and graphics.
A sensory-led format that combines food visuals with a spoken message.
A creator-led reaction that puts a news clip in context.
An animated explainer using maps, ballots and typography to explain how the system works.
04The Resonance Learning Loop
Bring creative work, testing and performance observations into a shared process, then use what you learn to inform the next iteration.
Scripts, messengers and formats go out.
Gather what people did, plus any testing.
Separate what connects from what to change.
Carry it into the next script or edit.
05The people

Interim President

Chief of Staff

Vice President

Help shape what comes next.